
Article 1 of 5
Why “Nothing Has Happened Yet” Is Not a Security Strategy
Every week, business owners across Michigan sit in boardrooms and budget meetings and say some version of the same thing: “We’ve been operating for eighteen years and never had a major breach. We must be doing something right.”
It’s an understandable conclusion. It’s also a dangerous one.
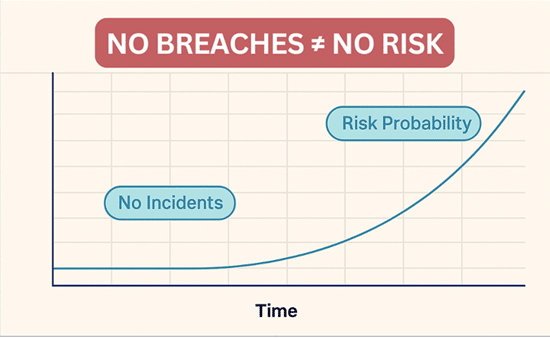
The absence of a recorded incident is not proof of low risk. In quantitative risk analysis, it is simply a lack of data and treating it as proof of safety is a cognitive trap that statisticians call the zero-probability fallacy. The moment a business assumes its risk is zero because nothing bad has happened yet, it has already made a critical error in judgment.
This article will walk you through the statistical reality of cyber risk, starting with a model called Laplace’s Rule of Succession, a powerful entry-level tool that every business owner can understand and apply. We will then show you where that model reaches its limits and introduce the more advanced frameworks that risk professionals use to make real investment decisions.
Whether you have zero breaches on your record or several, math has something important to tell you. Let’s listen.
Part One: The Entry-Level Baseline Laplace’s Rule of Succession
What Is Laplace’s Rule?
Laplace’s Rule of Succession was developed by the French mathematician Pierre-Simon Laplace in the eighteenth century to solve what was then called the “Sunrise Problem”: given
that the sun has risen every day for thousands of years, what is the probability that it will rise again tomorrow?
His insight was that just because something has always happened (or never happened) does not mean we can assign it a probability of 100% or 0%. There is always underlying uncertainty, and any honest statistical model must account for it.
The formula is elegant in its simplicity:
P = (s + 1) / (n + 2)
Where:
• s = the number of times the event has occurred (in our case, data breaches)
• n = the total number of time periods observed (in our case, years in business)
The “+1” and “+2” are called pseudocounts. They are added to prevent the formula from ever returning an answer of exactly 0% or 100%, which would be statistically overconfident. In essence, the formula says: “We’ll pretend we’ve seen one breach and one clean year that we haven’t actually observed, just to keep ourselves honest about uncertainty.
Applying the Formula to Real Business Scenarios
Let’s make this concrete. The table below shows three real-world company profiles and what Laplace’s Rule says about each.
| Company History | Breaches / Years | Formula | Annual Breach Risk |
| 18 years, zero breaches | 0 / 18 | (0+1) / (18+2) | 5.0% |
|
18 years, one breach (5 yrs ago) |
1 / 18 | (1+1) / (18+2) | 10.0% |
| 5 years, two breaches | 2 / 5 | (2+1) / (5+2) | 42.9% |
The numbers are striking. A company that has operated for eighteen years without a single incident still carries a statistically derived 5% annual probability of a breach. That is not a flaw in the formula, it is the formula doing exactly what it should: reminding us that a clean record is evidence of good fortune and good practices, not a guarantee of future immunity.
Even more striking is the middle scenario. A single breach in eighteen years, one that occurred five years ago, was remediated, and has not recurred, doubles the risk estimate to 10%. The formula does not take into account that the breach was resolved. It only knows that breaches have happened.
And the third scenario is where the mathematics delivers its most urgent message. Two breaches in five years produces a 42.9% annual probability. At that level, the question is no longer “will we be breached again,” it is “when.”
KEY INSIGHT: Even with 18 perfect years of operation, Laplace tells us the probability of a breach next year is 1-in-20. That is not alarming, but it is not zero. And treating it as zero is precisely how businesses get blindsided.
Part Two: The Problem with Looking Backward
Laplace Is a Lagging Indicator
Here is a critical limitation that every business leader needs to understand: Laplace’s Rule only knows what has already happened. It is a lagging indicator, a rearview mirror, not a windshield.
If your company invests in a state-of-the-art firewall, deploys multi-factor authentication across all systems, trains every employee on phishing recognition, and retains a dedicated cybersecurity partner on Monday, the Laplace formula will still return the same risk percentage on Tuesday. The formula has not changed because history has not changed.
This creates an important distinction between two different measures of risk that every business owner should understand.
For businesses that want to understand the real‑world probability of a breach and not just historical averages, a structured cybersecurity risk assessment is the next step.
Inherent Risk vs. Residual Risk
• Is the level of threat your business faces based purely on its history and industry? This is what Laplace measures. Inherent Risk
• Is the actual, real-world probability of a breach after your security controls are actively deployed and working. This is what your investments changes immediately. Residual Risk
These two numbers are not the same. And the gap between them is where most businesses fail to make their case to leadership.
Consider a company with a 42.9% inherent risk (two breaches in five years) that implements a comprehensive security program assessed to be 50% effective. Their residual risk drops to roughly 21.4% the day those controls go live. But if you ask the Laplace formula? It still says 42.9%. The formula will not register the improvement for years.
This is why cybersecurity is often a difficult budget conversation. The results are invisible in the statistics until another alternative breach forces a catastrophic update to the numbers.
THE ANALOGY: Laplace works like a credit score. You can make every right financial decision today, but a score that was damaged by two late payments three years ago will not recover overnight. It takes years of consistent, clean performance to rebuild a statistical reputation.
Part Three: The Recovery Problem
How Long Does It Take to Rebuild a Statistical Record?
For any business currently carrying elevated risk, particularly those in the 42% range after multiple incidents, the next natural question is: how long will it take for the math to reflect our improvements?
The answer is sobering. The table below shows the Laplace recovery path for a company that starts with two breaches in five years (42.86% probability) and then achieves a perfect record of zero additional breaches going forward.
| Years w/ Zero New Breaches | Total Years Observed (n) | Laplace Fraction | Calculation | Breach Probability |
| 0 (Today) | 5 | 3 / 7 | (2+1) / (5+2) | 42.86% |
| +1 year | 6 | 3 / 8 | (2+1) / (6+2) | 37.50% |
| +5 years | 10 | 3 / 12 | (2+1) / (10+2) | 25.00% |
| +10 years | 15 | 3 / 17 | (2+1) / (15+2) | 17.65% |
| +20 years | 25 | 3 / 27 | (2+1) / (25+2) | 11.11% |
| +40 years | 45 | 3 / 47 | (2+1) / (45+2) | 6.38% |
| +53 years | 58 | 3 / 60 | (2+1) / (58+2) | 5.00% |
To bring that 42.86% risk estimate down to the 5% baseline of a company with eighteen clean years, the mathematics requires fifty-three additional years of perfect performance.
This is not a design flaw. It is an honest reflection of the asymmetry of risk. One bad year can take your probability from 5% to over 40% in a single step. Recovering from that mathematically takes decades.
What Happens With a Third Breach?
If the same company experiences a third breach before completing its recovery, the formula updates immediately. The probability does not continue its slow decline it resets upward:
P = (3 + 1) / (5 + 2) = 4/7 = 57.14%
A third incident in that window pushes the annual probability above the coin-flip threshold. At that point, the business is no longer managing isolated events it is managing a recurring vulnerability that security controls must actively contain every single day.
This is why the purpose of a security program is not merely to lower a number on a spreadsheet. It is to prevent the events that reset the clock entirely.
Part Four: Moving to Professional Risk Modeling
When the Starter Formula Is No Longer Enough
- Laplace’s Rule is an excellent starting point. Authors like Douglas Hubbard, in How to Measure Anything in Cybersecurity Risk, recommend it specifically as a first-step tool for organizations with limited historical data. But it has real limitations that make it inadequate as a primary decision-making framework for growing businesses:
- It relies exclusively on your own history and ignores industry-wide breach data from businesses similar to yours.
- It produces different results depending on whether you measure in years, months, or days a problem known as time-unit bias.
- It cannot account for changes in the threat environment, new attacker techniques, or zero-day vulnerabilities that did not exist when your clean record was established.
- It does not update in real time based on warning signals; it only responds to completed events.
For businesses making serious investment decisions around cybersecurity insurance procurement, technology budgets, vendor contracts, and incident response planning, three more advanced approaches are worth understanding.
Beta Distribution Modeling: Using Peer Intelligence
Beta Distribution modeling is, in simple terms, an upgraded version of Laplace that allows your risk calculation to incorporate industry-wide data alongside your own history. Rather than assuming your company exists in isolation, it asks: What do we know about how often businesses like yours get breached?
For a small law firm in Michigan, this might mean incorporating breach data from hundreds of legal practices across the country. For a medical office, it means drawing on HIPAA incident reports and healthcare industry threat intelligence. The result is a risk estimate that reflects both your individual history and your operating environment, producing a more accurate and defensible baseline for investment decisions.
Monte Carlo Simulations: The “What If” Machine
Monte Carlo simulation is the tool of choice for businesses that need to answer a specific question: not “what is our probability of a breach,” but “what is our realistic range of financial exposure?
The technique runs thousands of simulated scenarios, sometimes tens of thousands, each one with slightly different assumptions about breach probability, incident severity, recovery costs, regulatory penalties, and lost business. The output is not a single number but a range: for example, “there is a 10% chance this company faces losses exceeding $450,000 in the next 36 months.”
This language is far more useful in a boardroom or insurance negotiation than a percentage probability. It converts statistical uncertainty into financial planning language that executives and CFOs can act on.
Bayesian Networks: Real-Time Risk Intelligence
Bayesian Networks represent the most sophisticated tier of risk modeling, and they address the single most important limitation of Laplace: the inability to update based on what is happening right now.
A Bayesian Network does not wait for a breach to occur before revising its risk estimate. It incorporates live signals, a surge in phishing attempts targeting your employees, a failed login from an unfamiliar geography, a near-miss incident that was contained before causing damage, and adjusts the probability in real time.
This transforms your risk assessment from a historical document into a living dashboard. Instead of asking “how many times have we been hit in the past,” a Bayesian system asks “how is our environment performing against today’s threat landscape?”
For businesses in regulated industries, such as legal, medical, accounting, and financial services, where a single breach can trigger client notification requirements, regulatory investigations, and reputational consequences that take years to recover from, this kind of real-time intelligence is no longer optional.
Part Five: Building a Living Risk Strategy
The Practical Takeaway for Michigan Business Owners
The statistical models discussed in this article are not designed to frighten you. They are designed to equip you with the intellectual framework to have honest, productive conversations about risk with your leadership team, your board, your insurer, and your technology partners.
Here is the practical summary:
- Laplace’s Rule is your starting point. Use it to accept, once and for all, that zero risk does not exist. Even a clean 18-year record carries a 5% annual baseline.
- Residual risk and inherent risk are different numbers. Security investments reduce your actual exposure immediately, even when the historical formula takes years to catch up.
- Incident asymmetry is real. A single breach is vastly easier to experience than to recover from statistically. Prevention is not just good security; it is the only mathematically efficient strategy.
- Advanced modeling tools exist. If you are making cybersecurity investment decisions based on gut instinct or historical percentages alone, you are working with incomplete information.
The goal of a mature cybersecurity program is not to achieve a lower number on a risk spreadsheet. It is to prevent the events that force that number upward and to build the kind of resilient, adaptive defense that adjusts faster than the threat landscape can evolve.
Frequently Asked Questions
If I’ve had zero breaches in 18 years, why is my risk still 5% and not 0%?
This is the zero-probability fallacy. Just because an event has not occurred does not mean it is impossible. Laplace’s formula adds pseudocounts to account for the underlying uncertainty in a world where threats constantly evolve. Assigning a 0% probability is considered dangerously optimistic by risk professionals and is not considered a credible baseline for planning.
I just invested in new security tools. Why doesn’t my risk percentage change immediately?
Laplace’s Rule is purely historical. It only knows what has happened, not what you are doing today. Your Residual Risk, the actual threat remaining after controls are deployed, drops the moment those controls go live. The statistical “reputation score”, however, only improves as you accumulate additional years of clean performance. Think of it like a credit score: it takes consistent good behavior over time to rebuild what a few bad events can damage quickly.
What happens to my risk percentage if we have just one minor breach?
The formula is highly sensitive to new incidents. For a company with an 18-year clean record, a single breach immediately doubles the estimated probability from 5% to 10%. For a company with a shorter history and existing breaches, the impact is even more pronounced. The formula treats all breaches equally a minor incident resets the statistical recovery clock in the same way a catastrophic one does.
Is the 5% number accurate enough to use for insurance or budget planning?
Laplace is best used as a starting point and a sanity check, not as a primary decision-making tool for formal budget or insurance purposes. Its limitations, including time-unit bias and its exclusion of industry-wide data, make it insufficient for high-stakes financial planning. For formal budgeting, the appropriate tools are Monte Carlo Simulations and Beta Distribution Modeling, which incorporate broader data sets and produce financial exposure ranges rather than single-point probabilities.
How can I reduce my risk score faster than waiting decades?
You cannot accelerate the historical Laplace math, but you can shift to a more sophisticated framework. Bayesian Network models allow you to update your risk score based on real-time operational signals: failed phishing attempts, near-miss incidents, and the successful deployment of new security layers. This moves the conversation from “how long has it been since we were hit” to “how well are our current defenses performing against today’s threats.”
Does any of this change based on my industry?
Yes significantly. Industries such as legal, medical, accounting, and financial services face elevated inherent risk due to the sensitivity and regulatory value of the data they hold. A law firm experiencing a single breach does not simply face IT recovery costs it faces potential violations of professional conduct rules, bar association scrutiny, and client trust consequences that cannot be quantified by Laplace alone. Advanced modeling that incorporates industry-specific breach rates is strongly recommended for regulated businesses.
This is Part 1 of our Cyber Risk Intelligence Series.
Read other parts here: Part 2, start here: 👉 When the Math Gets Serious: Beta Distribution, Monte Carlo & Bayesian Models
Part 3, start here:👉 When the Breach Happens: Ransomware, Incident Response, and What the First 72 Hours Really Look Like
Part 4 start here: 👉The Human Firewall: Why Employees Are Your Strongest Cyber Defense
Part 5, start here: 👉The SMB Security Investment Equation: Priorities That Reduce Breach Costs
Cyber Risk Glossary for Business Owners
The following terms are used throughout this article and in professional cybersecurity risk discussions. Understanding this language bridges the gap between technical security and business decision-making.
Core Risk Framework
Inherent Risk
The natural level of risk your business faces before any security controls or mitigations are in place. It is typically based on your industry, company history, and historical breach frequency.
Control Effectiveness
The measurable percentage by which your security measures, such as Multi-Factor Authentication, encryption, endpoint protection, or staff training, reduce your inherent risk.
Residual Risk
The actual threat that remains after your security controls have been successfully deployed and are actively operating. This is the real-world probability of a breach today, and it decreases the moment effective controls are in place even before historical statistics reflect the change
Statistical Concepts
Laplace’s Rule of Succession
A mathematical formula [P = (s+1) / (n+2)] is used as an entry-level tool to estimate the probability of a future breach based on past history. It prevents the zero-probability fallacy by adding pseudocounts that acknowledge underlying uncertainty.
Zero-Probability Fallacy
The dangerous misconception is that because a data breach has not occurred in the past, the probability of one in the future is zero. This is considered statistically invalid and practically harmful as a planning assumption.
Lagging Indicator
A metric that is purely backward-looking. Laplace’s Rule is a lagging indicator because it reflects only past events and does not register the new security tools or controls you implement today.
Frequentist Approach
Calculating probability strictly by dividing past incidents by total time periods (s/n). This approach is discouraged in cybersecurity because it assigns 0% risk to any business that has not yet been breached, which is statistically indefensible.
Time-Unit Bias
A limitation of certain statistical models where the result changes significantly depending on whether you measure by day, month, or year. Laplace’s Rule is subject to this bias, which is one reason it should not be used as a standalone tool for formal risk management.
Advanced Risk Modeling
Monte Carlo Simulation
A professional modeling technique that runs thousands of hypothetical breach scenarios to project a realistic range of financial outcomes and their probabilities. Instead of a single risk percentage, it produces actionable financial exposure ranges for use in budgeting and insurance planning.
Bayesian Networks
Advanced risk models that update your breach probability in real time as new signals emerge, including near-misses, failed phishing attempts, and changes in your security posture, rather than waiting for a completed breach event. Considered the most responsive and accurate tool for ongoing cyber risk management.
Beta Distribution Modeling
A sophisticated extension of the Laplace formula that allows professionals to incorporate industry-wide breach data alongside your company’s own history. It produces a more accurate and context-aware baseline than internal data alone.
Reference Classes
Industry-wide data from similar businesses used to set a risk baseline. Rather than relying exclusively on your own company’s limited history, reference classes give your risk estimate the context it needs to be credible for planning and insurance purposes.
Pseudocounts
The imaginary “+1” and “+2” values added in Laplace’s formula to prevent mathematically extreme conclusions (0% or 100% probability). They represent the statistical acknowledgment that no company has a perfectly predictable future.
Know Your Number. Reduce Your Risk.
If reading this article made you wonder what your Laplace number looks like or whether your current security posture is actually reducing your Residual Risk the next step is a conversation.
Our team works with Michigan’s small and mid-sized businesses in legal, medical, accounting, real estate, and construction to build cybersecurity programs that are practical, affordable, and grounded in real risk data. We speak plain English, not geek speak. And we don’t believe in one-size-fits-all solutions.
We offer tailored pricing built around your specific needs and risk profile. Flat-rate options are also available for businesses that prefer budget-line predictability.
Visit www.cyberprotectllc.com or call us (586) 500-9300 to speak with a Michigan cybersecurity specialist.
“No Geek Speak. No Hassles. Just Real Protection.”
Editorial note: This article was assisted by AI tools and reviewed by cybersecurity professionals at Cyber Protect LLC for accuracy, clarity, and relevance.
About the Author

Cheyenne Harden
CEO